Topological Analysis of LArge Scale Simulations (TALASS)

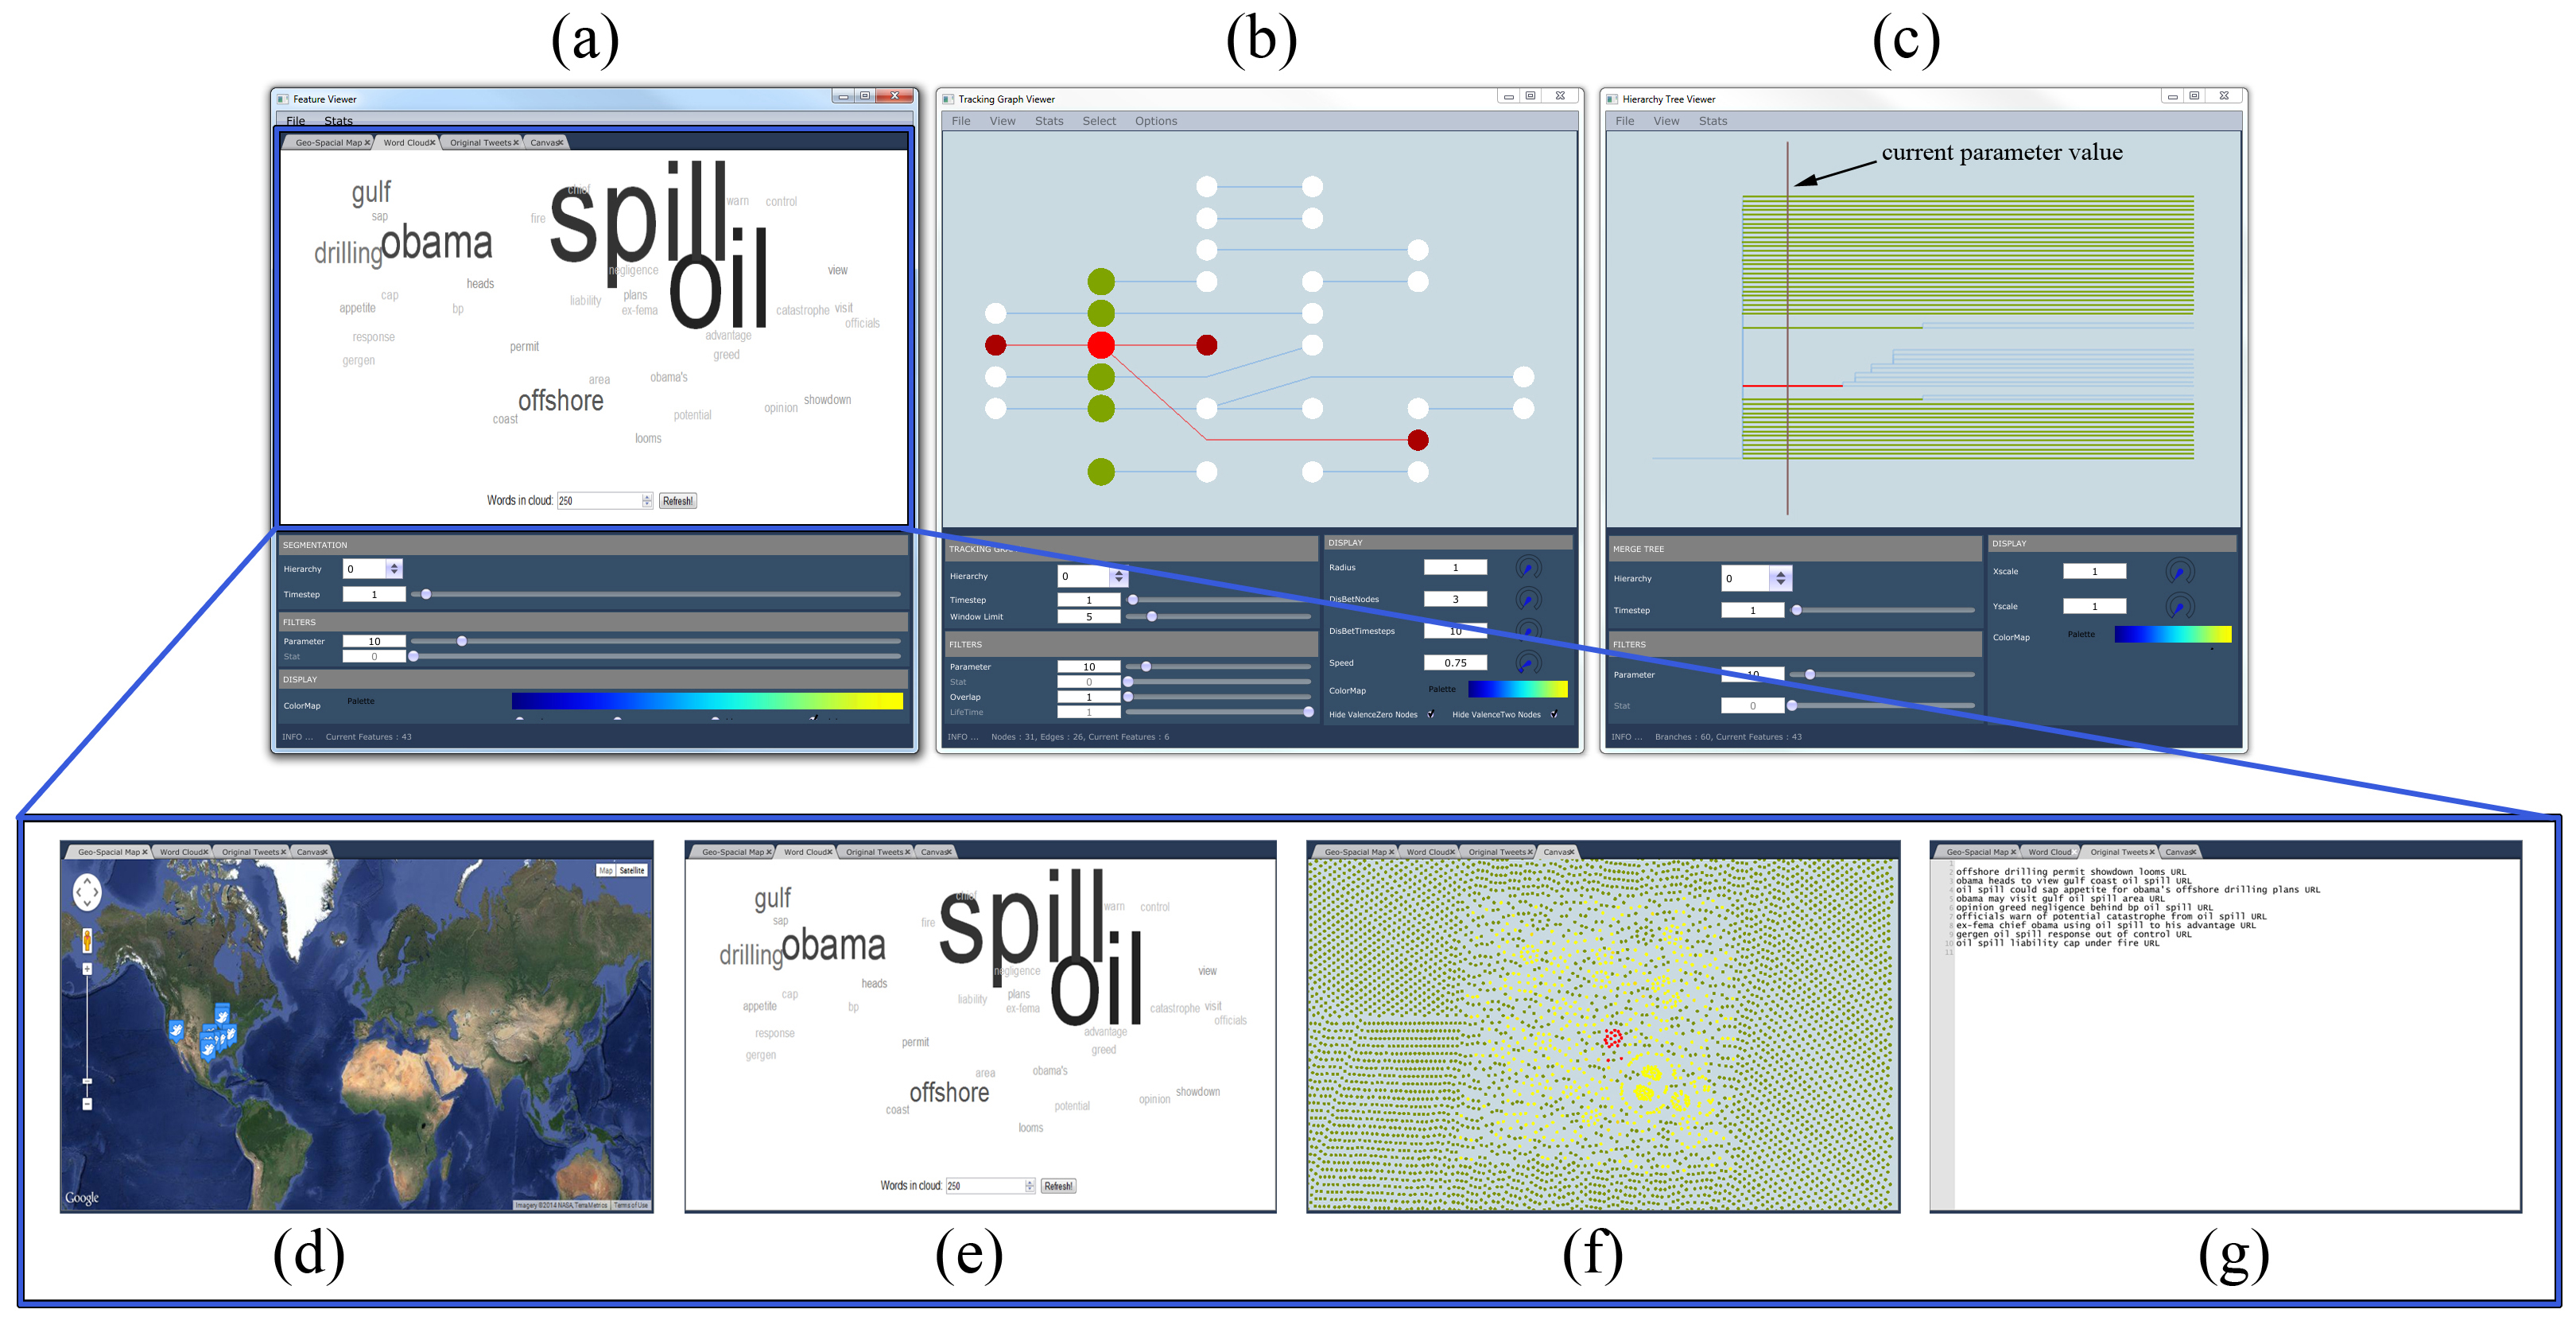
Tracking features and exploring their evolution over time has long been one of the most common analysis tasks for a variety of applications in science and technology. Usually, this proceeds in three steps: First, the feature-of-interest within a data set needs to be defined; Second, features should be correlated, i.e. tracked, between successive time steps; and Third, the resulting feature tracks need to be analyzed. Tracking graphs which show the evolution of features as a collection of feature tracks that split/merge over time are one of the most common approaches used to illustrate feature evolution over time.

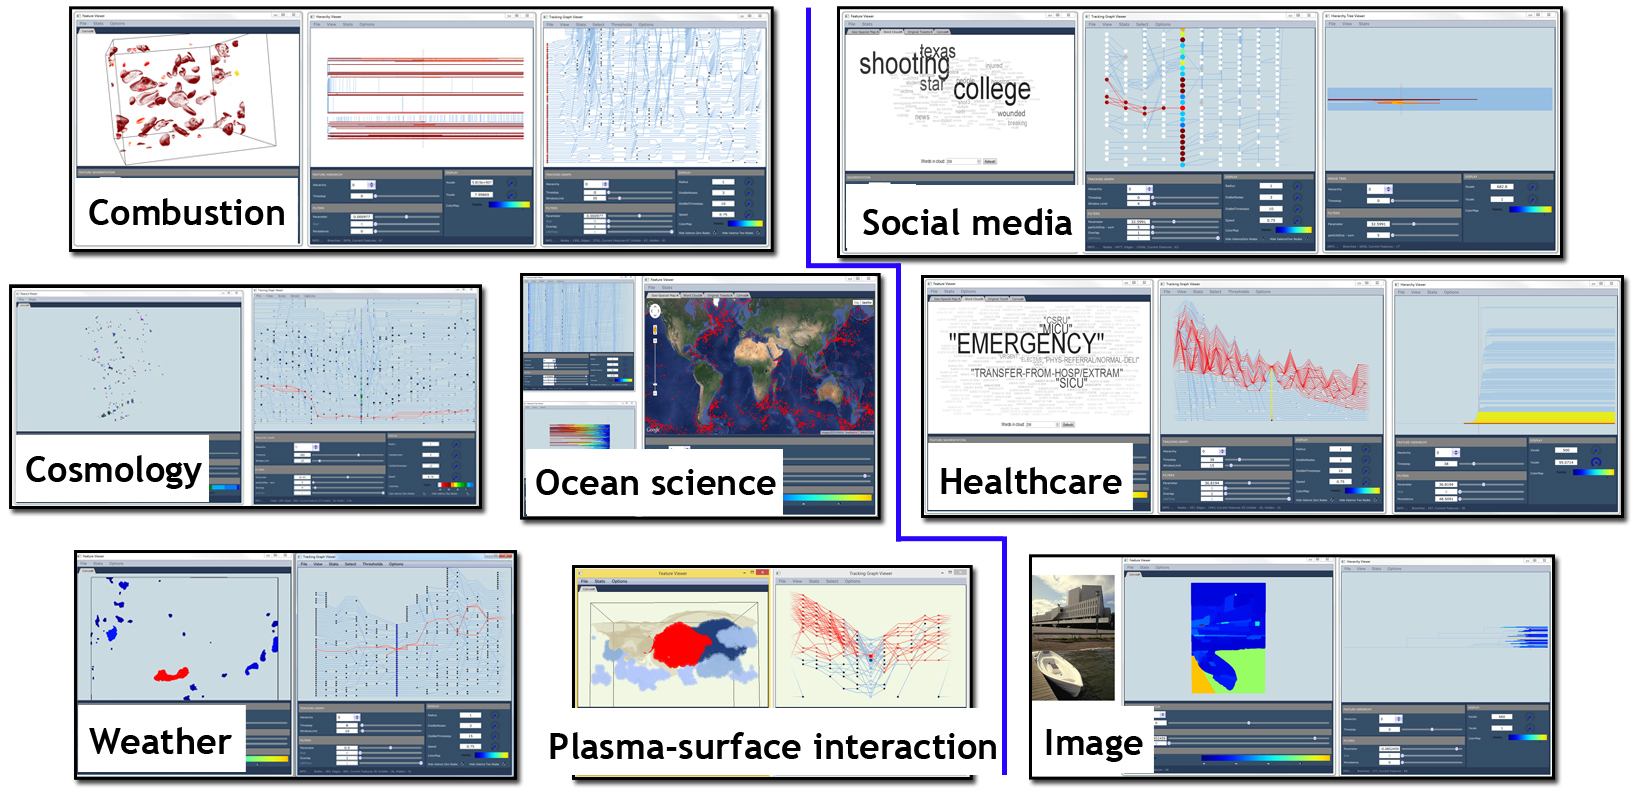
In this work, we present a general and flexible analysis environment which enables interactive exploration of feature evolution in time-varying data sets, regardless of the underlying data type. This framework couples hierarchical feature definitions with progressive graph layout algorithms to provide an interactive exploration of dynamically constructed tracking graphs. By making use of appropriate abstractions for feature definitions and their correlations and by utilizing suitable visual metaphors, we design this framework for addressing the general task of understanding feature evolution over time.

trackinggraph

A simple tracking graph showing the evolution of features across time. Within the graph, each set of nodes in a vertical column represents features in one time step and shows the “tracks” of each feature as it evolves: splits, merges or disappears.

User Interface

Our visualization environment contains of three different views. The first two presenting general conceptual views of the time dependent feature hierarchies, the third presenting a more specialized view for feature embedding. Within our framework, data is always presented with respect to a user-defined focus time step that is processed first. Subsequently, data is extracted and presented for neighboring time steps in order of increasing distance. As such, all views designed for only a single time step, i.e. feature embedding view and feature hierarchy view, use the focus to determine their time step. Furthermore, all views coordinate parameters to provide a fully linked analysis environment.

UI
  • Feature Embedding View (a): Here, several visualization techniques are combined to present a specialized view for feature embedding. Specifically, we integrate geometric, geospatial, word cloud and textual visualizations, see (d)-(g).
  •  

  • Feature Tracking View (b): Here, the evolution of features is visualized with the use of tracking graphs. Starting from the user-defined focus time step, nodes and edges are iteratively added to the graph in both forward and backward in time up to the user-defined time window. Each set of nodes in the same x coordinate indicates features in one time step and edges across them indicate their correlations. For visual clarity, the set of nodes in the focus time step are always displayed in prominent colors. For interactivity, progressive techniques are used to both layout and visualize these tracking graphs.
  •  

  • Feature Hierarchy View (c): This component is dedicated to visualizing the feature groupings within time steps. Here, the graph for the feature hierarchy is visualized in the form of a tree. Given a data set, the graph layout of each timestep's feature hierarchy follows the depth-first ordering of its features and is computed only once (as the data is read for the first time). When the focus time step is changed, its feature hierarchy is visualized using the computed graph layout and as the scale changes the active feature groupings are highlighted.

Functionality

  • For storing the features within a time step we make use of a nested feature hierarchy, which encodes the clustering hierarchy of features for a range of parameter values. This creates a meta-representation that encodes all possible features for the entire parameter range within a time step. Once this hierarchy is computed, features and their attributes can be quickly and easily extracted for any parameter within its range and thus makes interactive feature selection possible.
  •  

  • For storing the feature correlations, we make use of a new flexible, efficient and compact structure called a meta-graph which, similar to the feature hierarchy, stores not one particular tracking graph but instead the entire family of graphs for all possible feature parameters.
  •  

  • Using the feature hierarchies and meta-graph, we have the capability to interactively extract tracking graphs for a particular parameter and correlation metric value.
  •  

  • These tracking graphs are always processed with respect to a user-defined focus time step and a window of interest, and we make use of progressive graph layout algorithms for computing the graph layouts to reduce edge intersections.
  •  

  • Our framework has the capability to interactively define and extract sub-graphs to isolate interesting feature tracks in tracking graphs. Specifically, we use two different approaches: filtering and feature selecting.
  •  

  • We also exploit the flexibility in defining temporally and spatially varying parameters for simplifying the resulting tracking graphs to promote new scientific insights. This, for the first time, enable construction of temporally stable and thus easier to comprehend tracking graphs.

Examples

We demonstrate the utility and generality of this framework using several large-scale scientific and non-scientific data sets. In particular, we make use of combustion, cosmology, ocean science, weather and plasma-surface interaction data sets in the scientific domain and social media, healthcare and image data sets within the non-scientific domain.

UI

Publications

  • Interactive Visualization and Exploration of Patient Progression in a Hospital Setting, W. N. Widanagamaachchi, Y. Livnat, P.-T. Bremer, S. Duvall, and V. Pascucci., Proceedings of the AMIA 2017 Annual Symposium, 2017.
  •  

  • Exploring the Evolution of Pressure-Perturbations to Understand Atmospheric Phenomena, W. N. Widanagamaachchi, A. Jacques, B. Wang, E. Crosman, P.-T. Bremer, V. Pascucci. and J. Horel., Proceedings of 2017 IEEE Pacific Visualization Symposium (PacificVis), Seoul, Korea, 2017.
  •  

  • Tracking Features in Embedded Surfaces: Understanding Extinction in Turbulent Combustion, W. N. Widanagamaachchi, P. Klacansky, H. Kolla, A. Bhagatwala, J. Chen, V. Pascucci and P.-T. Bremer., Proceedings of IEEE symposium on Large-Scale Data Analysis and Visualization (LDAV), Chicago, USA, 2015.
  •  

  • Visualization and Analysis of Large-Scale Atomistic Simulations of PlasmaSurface Interactions, W. N. Widanagamaachchi, K. Hammond, L.-T. Lo, B. Wirth, F. Samsel, C. M. Sewell, J. Ahrens and V. Pascucci., Proceedings of EuroVis - Short Papers, Cagliari, Italy, 2015.
  •  

  • Data-Parallel Halo Finding with Variable Linking Lengths, W. N. Widanagamaachchi, P.-T. Bremer, C. Sewell, L.-T. Lo, J. Ahrens and V. Pascucci, Proceedings of the IEEE symposium on Large-Scale Data Analysis and Visualization (LDAV), Paris, France, 2014.
  •  

  • Interactive Exploration of Large-Scale Time-Varying Data using Dynamic Tracking Graphs, W. N. Widanagamaachchi, C. Christensen, P.-T. Bremer and V. Pascucci, Proceedings of IEEE symposium on Large-Scale Data Analysis and Visualization (LDAV), Seattle, USA, 2012. (Nominated for Best Paper)

Presentations

  • Interactive visualization and exploration of patient progression in a hospital setting, W. N. Widanagamaachchi, Y. Livnat, P.-T. Bremer, S. Duvall, and V. Pascucci., 2016 Workshop on Visual Analytics in Healthcare, Chicago, USA, 2016.
  • Understanding Feature Evolution Over Time For Large-scale Time-varying Datasets, W. N. Widanagamaachchi and V. Pascucci., Doctoral Colloquium, VisWeek, Chicago, USA, 2015.

Posters