A Tool For Comparative Functional Genomics


Pathline


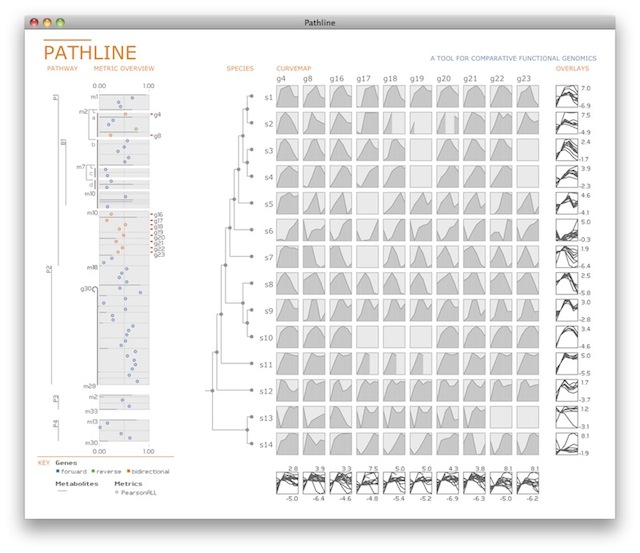
Pathline is a visualization tool for comparative functional genomics that supports analysis of three types of biological data at once: functional data such as gene activity measurements; pathway data that presents a series of reactions within a cellular process; and phylogenetic data describing ancestral relationships between species.
The design of Pathline includes two new visual encoding techniques. The first is an encoding of a linearized metabolic pathway representation that provides appropriate topological information and supports the comparison of quantitative data along the pathway. The second is a curvemap, a matrix layout of temporal expression data for enhanced perception of trends in gene and cell activity levels across multiple species.
This work was developed by Miriah Meyer and Bang Wong as part of the Data Visualization Initiative at the Broad Institute, in collaboration with Tamara Munzner, Mark Styczynski, Hanspeter Pfister, and the members of the Regev Lab. Please email Miriah and Bang with questions and feedback.
We have a companion paper for this work that describes the design process and decisions that went into the making of Pathline. This paper appeared as part of the proceedings of the 2010 Eurographics/IEEE Symposium on Visualization (EuroVis).
Pathline:A Tool For Comparative
Functional Genomics. Miriah Meyer, Bang Wong, Mark
Styczynski, Tamara Munzner, and Hanspeter Pfister. Computer Graphics Forum (Proc. EuroVis 2010), 29(3):1043-1052.
pdf | images | presentation