 |
 |
 |
|
|
|
Multivariate graphs are an important data type in many high-impact application areas. Yet we know little about the underlying principles of how to effectively visualize them. Despite the plethora of techniques and methods for visualizing graphs, much of this work breaks down when attempting to visualize more than one or two additional attributes — there are simply not enough visual channels to succinctly show all aspects of a rich, complex multivariate graph. Compounding this challenge is the large design space of possible encodings, making it difficult for visualization practitioners to design effective visualizations of multivariate graphs using a top-down, problem-agnostic approach. This project will establish the first set of validated, foundational principles for visualizing multivariate graphs using a structured, methodological research approach. Several target application areas will drive the investigations using a design study approach. These areas were chosen to represent a wide spectrum of possible applications in which multivariate graphs play a central role, thus fostering generalizable results.
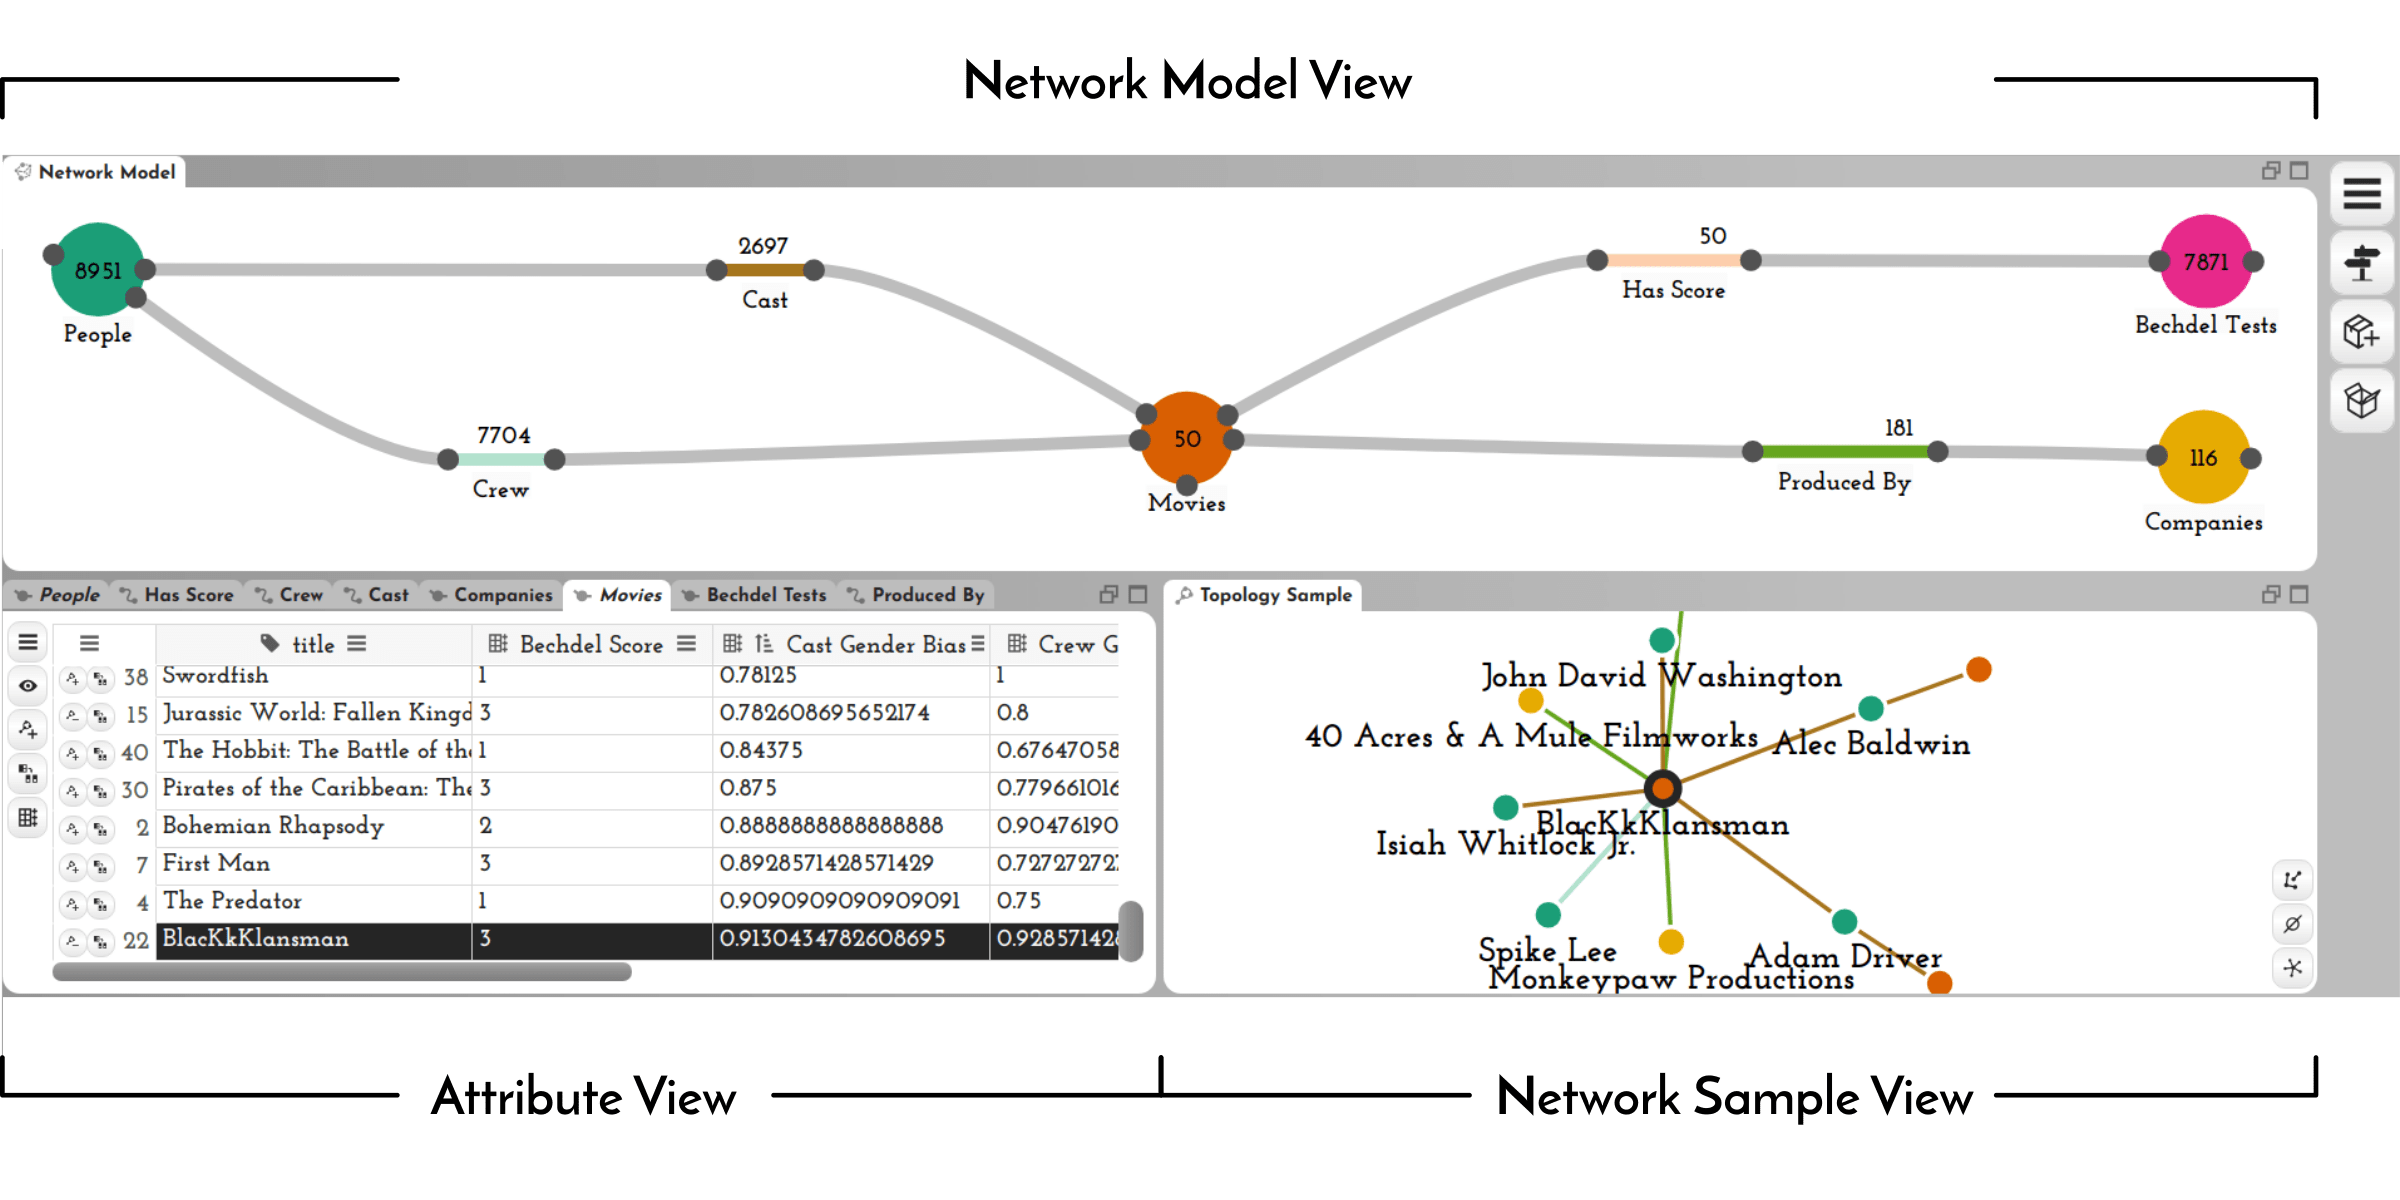
Networks are a natural way of thinking about many datasets. The data on which a network is based, however, is rarely collected in a form that suits the analysis process, making it necessary to create and reshape networks. Data wrangling is widely acknowledged to be a critical part of the data analysis pipeline, yet interactive network wrangling has received little attention in the visualization research community. In this technique, we implement a set of operations that are important for wrangling multivariate network datasets. Key operations include creating a network from source data such as tables, reshaping a network by introducing new node or edge classes, filtering nodes or edges, and deriving new node or edge attributes. Our technique enables analysts to execute these operations with little to no programming, and to immediately visualize the results. It provides views to investigate the network model, a sample of the network, and node and edge attributes.
CONNECTIVITY MATRIX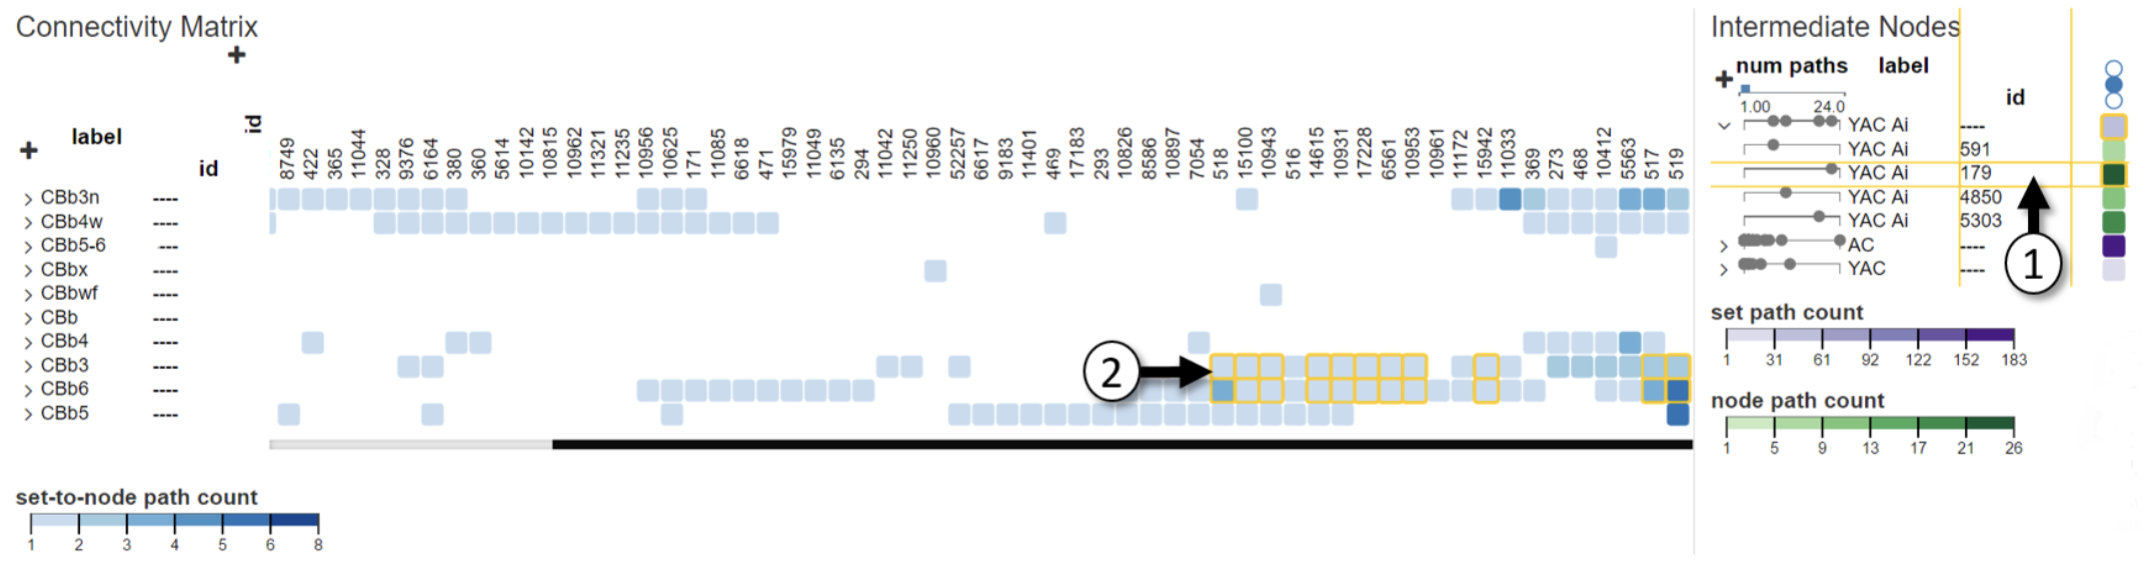
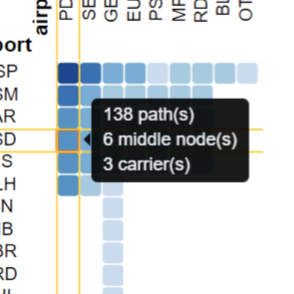
A key task in multivariate graph analysis is the exploration of connectivity, to, for example, analyze how signals flow through neurons, or to explore how well different cities are connected by flights. While standard node-link diagrams are helpful in judging connectivity, they do not scale to large networks. Adjacency matrices also do not scale to large networks and are only suitable to judge connectivity of adjacent nodes. A key approach to realize scalable graph visualization are queries: instead of displaying the whole network, only a relevant subset is shown. Query-based techniques for analyzing connectivity in graphs, however, can also easily suffer from cluttering if the query result is big enough. To remedy this, we introduce a technique called the connectivity matrix that provide an overview of the connectivity and reveal details on demand.
VISUALIZATION OF PATHS THROUGH SPATIALLY-CONSTRAINED NODES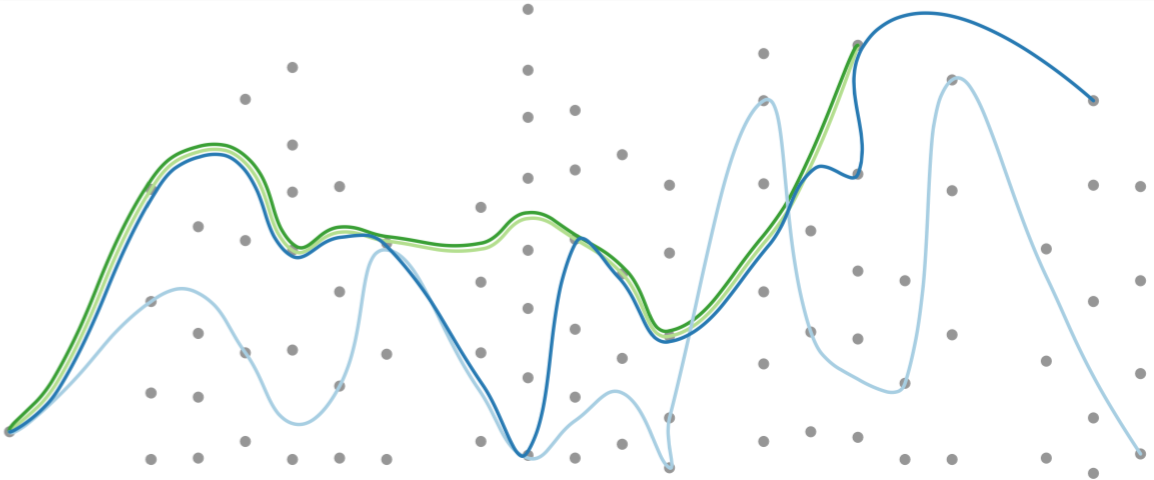
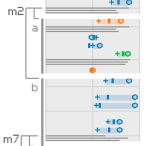
Graphs that consist of nodes that are spatial constrained -- such nodes with a geospatial location -- are difficult to visualize due to the inability to move nodes to reduce visual clutter. Tackling this challenge, we developed a novel technique that supports visualization of paths through spatially constrained graphs. The technique reduces visual clutter while also maintaining visibility of all nodes through an algorithm that reroutes edges around non-path nodes, while also ensuring that individual, intersecting paths are visible. This technique supports visualization and analysis of the intersecting and diverging nature of paths.
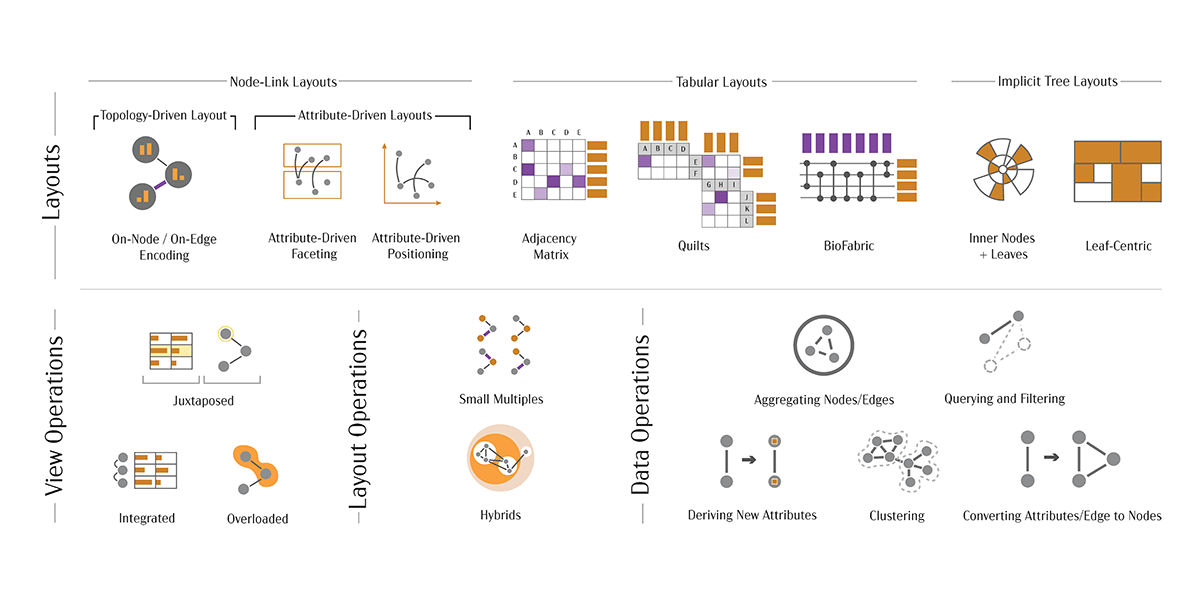
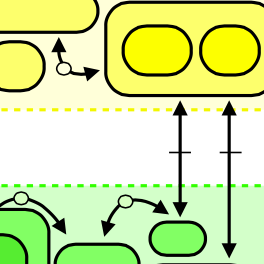
Multivariate networks are made up of nodes and their relationships (links), but also data about those nodes and links as attributes. Most real-world networks are associated with several attributes, and many analysis tasks depend on analyzing both, relationships and attributes. Visualization of multivariate networks, however, is challenging, especially when both the topology of the network and the attributes need to be considered concurrently. We analyzed current practices and classify techniques along four axes: layouts, view operations, layout operations, and data operations. We also provide an analysis of tasks specific to multivariate networks and give recommendations for which technique to use in which scenario. Finally, we survey application areas and evaluation methodologies.
A FRAMEWORK FOR CREATIVE VISUALIZATION-OPPORTUNITIES WORKSHOPS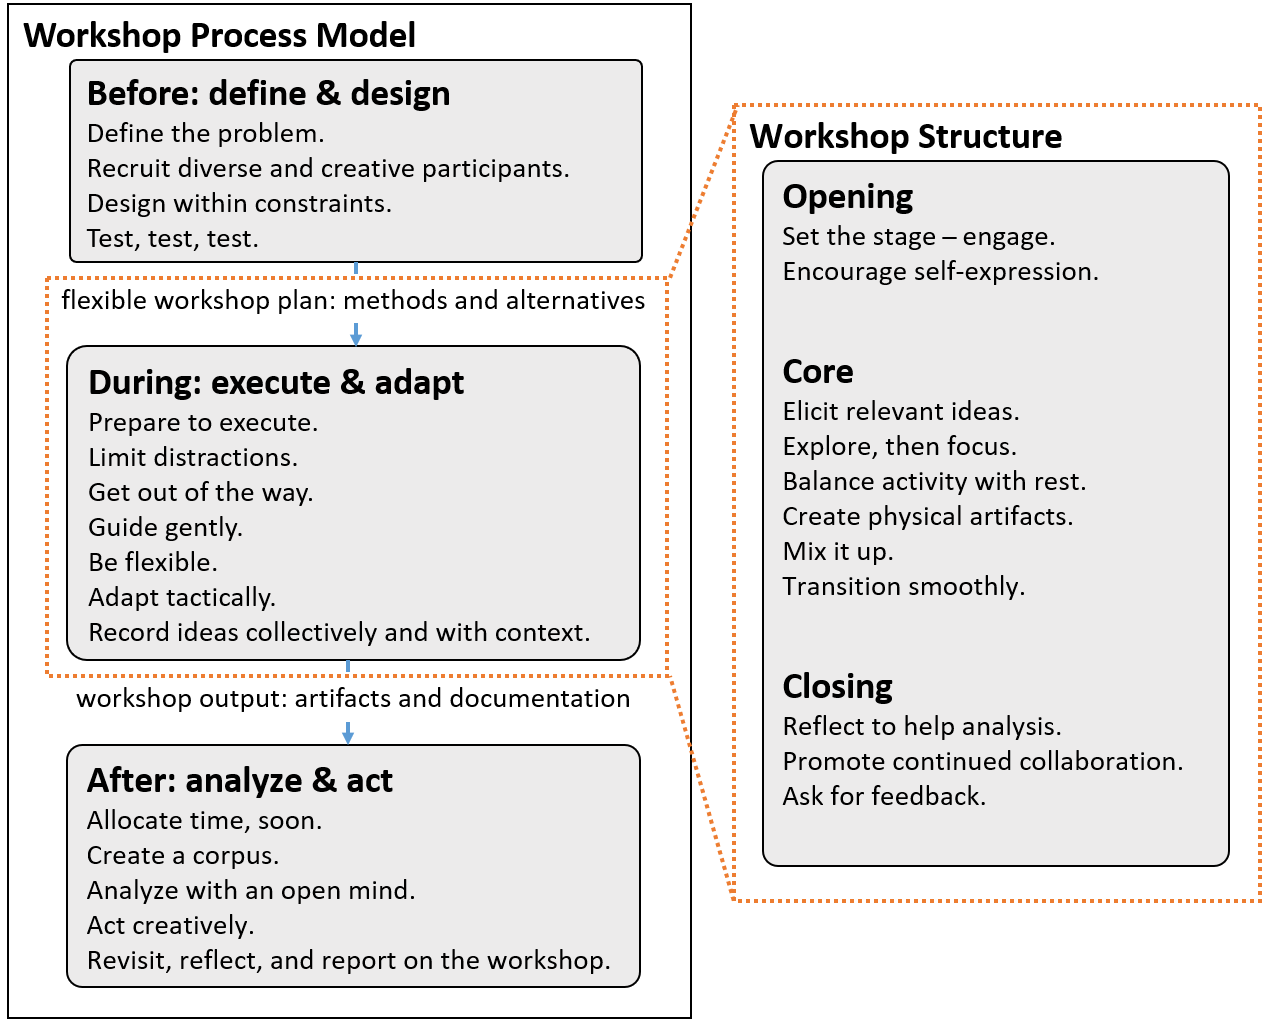
Applied visualization researchers often work closely with domain collaborators to explore new and useful applications of visualization. The early stages of collaborations are typically time consuming for all stakeholders as researchers piece together an understanding of domain challenges from disparate discussions and meetings. A number of recent projects, however, report on the use of creative visualization-opportunities (CVO) workshops to accelerate the early stages of applied work, eliciting a wealth of requirements in a few days of focused work. Yet, there is no established guidance for how to use such workshops effectively. Through a two-year collaboration in which we analyzed the use of 17 workshops in 10 visualization contexts we developed a framework for CVO workshops that 1) identifies a process model for using workshops; 2) describes a structure of what happens within effective workshops; 3) recommends 25 actionable guidelines for future workshops; and 4) presents an example workshop and workshop methods.
ACTION DESIGN RESEARCH FOR APPLIED VISUALIZATION RESEARCHIn applied visualization research, artifacts are shaped by a series of small design decisions, many of which are evaluated quickly and informally via methods that often go unreported and unverified. Such design decisions are influenced not only by visualization theory, but also by the people and context of the research. While existing applied visualization models support a level of reliability throughout the design process, they fail to explicitly address the influence of the research context in shaping the resulting design artifacts. In this work, we look to action design research (ADR) for insight into filling this gap. In particular, ADR offers a framework along with a set of guiding principles for navigating and capitalizing on the disruptive, subjective, human-centered nature of applied design research, while aiming to ensure reliability of the process and design.
NESTED BLOCKS AND GUIDELINES MODEL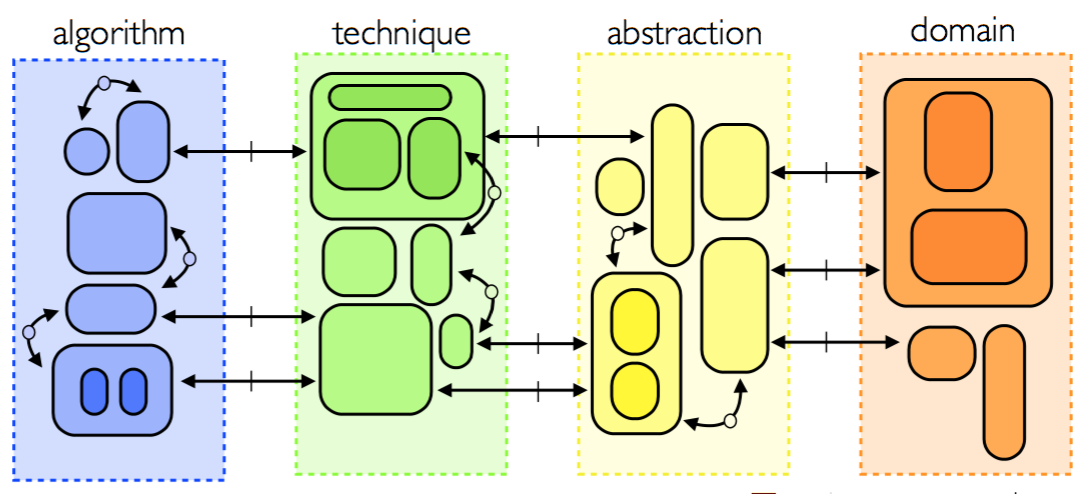
The nested blocks and guidelines model for describing visualization design decisions extends previous models to provide explicit mechanisms that capture and discuss design decision rationale. Blocks are the outcomes of design decisions throughout the design process, and guidelines discuss relationships between these blocks. Using the NBGM we are able to more concretely identify possible weaknesses in exisitng and new guidelines, clarify assumptions that require further evaluation, and provide feedback on the rigor and validity of visualization research results.
Associate Professor, School of Computing, University of Utah

PhD student

Ethan Kerzner, PhD student
Nina McCurdy, PhD student
Josh Dawson, MS student
| teaching | Each fall we teach a class on the fundamental concepts of visualization in the School of Computing at the University of Utah. This course is a mix of undergraduate and graduate students. The syllabus, lecture materials, and readings can be found on the course website. Starting in Fall 2019 we will introduce a new visualization course targeting early-stage understudents. |
| outreach |
We have conducted a number of events to teach high school girls about visualization and computer science. Through an annual collaboration with local high schools, we give short talks to girls about the power of visualization, and answer questions about being a computer scientist. We are also involved with the annual NCWIT Aspirations Awards that recognizes young women who are active and interested in computing and technology, and encourages them to pursue their passions. |
last update October 15, 2020